 Journal for Advances in Science
Research article | Published November 2, 2022 | Original research published in NeuroImage
New Analysis Provides Comprehensive Insights into the Human Brain’s Organization
Stefanie Flunkert
Stefanie Flunkert is a scientific writer with a Ph.D. in neuroscience and the founder of BioDoks.
Original research: Zachlod D, Bludau S, Cichon S, Palomero-Gallagher N, Amunts K. Combined analysis of cytoarchitectonic, molecular and transcriptomic patterns reveal differences in brain organization across human functional brain systems. NeuroImage. 2022 Aug 15; 257:119286. https://doi.org/10.1016/j.neuroimage.2022.119286.
Subjects: Cytoarchitecture, Receptor architecture, Julich Brain Atlas, Allen Human Brain Atlas, Cortical organization
New Ground article reviewed by: Katrin Amunts
How are the structures of human brain systems related to their function? A recent multimodal study used the Julich Brain Atlas to combine data on cytoarchitecture and receptor densities with gene expression data from the Allen Human Brain Atlas to improve our grasp of this relationship. The results of this study not only enhance our general understanding of the human brain but are also relevant for revealing the mechanisms underlying various brain diseases.
Hierarchy in functional brain systems
Information processing across different brain areas follows a hierarchical pattern, which is particularly visible in the sensory and motor systems of the brain. While primary sensory areas receive information from the periphery – e.g. the skin, eyes, ears, and nose –, secondary and tertiary areas of sensory and motor systems and so-called higher associative brain areas integrate extensive information from various areas. The question is, however, how this flow of information is reflected at the level of the brain’s microstructure, including by gene expression and receptor density patterns in cytoarchitectonically defined areas.
Each brain area is unique in terms of these patterns. While they have been extensively studied in rodents, knowledge about the human brain is still limited. The new study helps to fill this gap with a comprehensive approach, identifying systematic changes across brain areas that correspond to the areas’ hierarchical level of information processing.
Neurotransmitter systems and their receptors
Receptors are key molecules for information processing with excitatory, inhibitory or modulatory functions. They are located in the cell membrane of neurons and act by binding specific signaling molecules called neurotransmitters, such as dopamine, serotonin, and others. Neurotransmitters circulate in the brain in different quantities at different times, and their binding to receptors converts into a signal cascade inside the cell.
One type of receptor that influences the firing of neurons is called ionotropic. These receptors work by opening a channel that allows electrically charged molecules to flow into the cell. The other type that transduces signals is called metabotropic and belongs to a class called G-protein coupled receptors.
Receptor types differ in their density between brain areas but also between layers within a given area. The densities of different receptor types within an area are in a certain balance, forming a specific receptor density pattern. Such patterns are not only relevant to understanding brain structure in healthy subjects but are also of considerable interest for therapeutic approaches, since density imbalances between receptor types as well as between their structural components, called subunits, can be related to the development of several diseases, such as epilepsy, neuropathic pain, Alzheimer’s and Huntington’s disease.
The subunits of ionotropic receptors are encoded by several different genes. The cell “reads” these genes as a blueprint of genetic information to form the corresponding molecular structures. While the base genetic information is the same in every cell of the body, the rate of individual genes being read can vary greatly across the tissue. Genes can be highly expressed in some places and less in others, which again forms a pattern that can be investigated using transcriptomic methods.
The fact that ionotropic receptor subunits are encoded by separate genes, and that their subunits can be combined in different ways, results in high variability of the receptor structure and even in alterations in its function and other properties. Therefore, the patterns of receptor distribution and gene expression are connected in an extremely complex and significant way, and shape brain function and dysfunction alike.
Comprehensive analysis of multimodal data
In their NeuroImage publication “Combined analysis of cytoarchitectonic, molecular and transcriptomic patterns reveal differences in brain organization across human functional brain systems,” Katrin Amunts and her team evaluated the relationship between expression patterns for a number of genes encoding certain neurotransmitter receptors and corresponding receptor densities in microscopically defined areas.
Going from genes to receptor densities is a multistep procedure. Put simply, DNA is transcribed to RNA, which leaves the cell nucleus to be translated to proteins such as receptors. But transcription and translation are regulated by several positive and negative feedback systems, which results in nonlinear RNA-to-protein ratios. These processes are highly dynamic for most genes, temporally as well as spatially, making actual RNA-to-protein ratios an important parameter for studies of the brain.
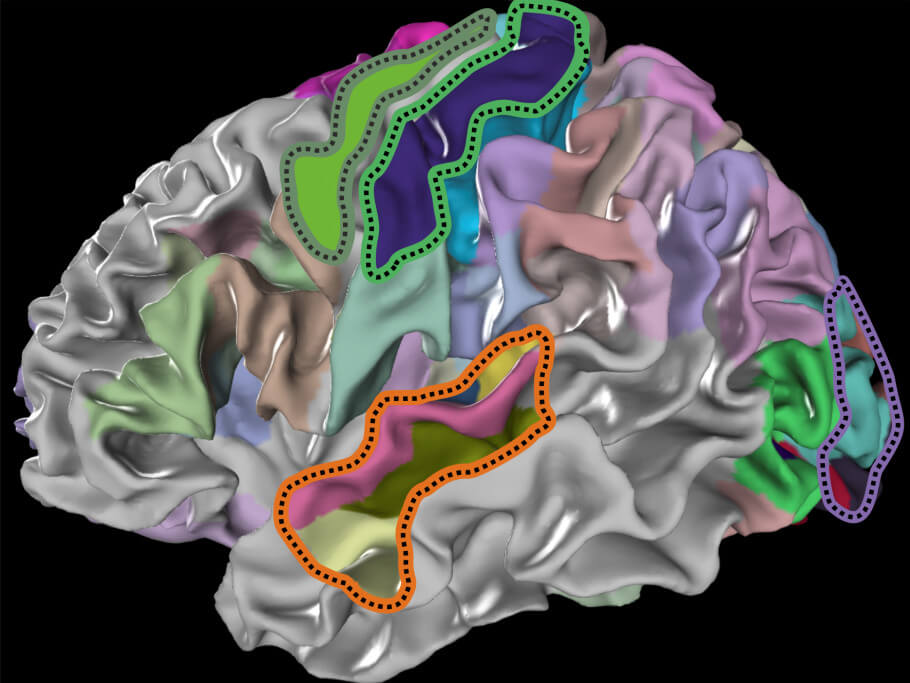
The team studied twelve metabotropic and ionotropic receptors of five different neurotransmitters that were present in all the cytoarchitectonic brain areas they analyzed. Their comprehensive analysis included 15 cortical areas of the visual, auditory, somatosensory, and motor system, all of which are mapped in the Julich Brain Atlas. This three-dimensional atlas of the human brain, created by Amunts and her team, contains cytoarchitectonic maps of more than 250 brain areas. As part of the multi-level atlas of the Human Brain Project, it is openly available and provides a spatial reference to integrate different modalities, including neurotransmitter receptor densities and gene expression data, as well as functional and connectivity data.
In their study, Amunts and her team conducted receptor density analyses using quantitative receptor autoradiography, a technique that relies on radioactively labeled ligands that selectively bind to certain receptors. The radiation of the labeled brain sections is then recorded on a film, and the receptor distribution and density are analyzed based on the signal strength. The receptor density is subsequently visualized as a false-color image.
The results of these receptor density analyses were then combined with gene expression data from the Allen Human Brain Atlas, which provides microarray transcriptome information based on 62,000 gene probes from the adult human brain. The data thus contains measurements of the RNA levels of these genes in a given, cytoarchitectonically defined brain area.
Unique gene expression and receptor density fingerprints
The research team’s results show that each of the brain areas studied has a unique gene expression and receptor density pattern, or “fingerprint,” and that the differences between these fingerprints are more pronounced between cortical areas of different functional systems, such as the somatosensory or motor system, than between areas within the same functional system. Specifically, analysis of the gene expression in auditory and visual cortical areas revealed major differences; among others, subunit genes of the ionotropic GABAA and glutamatergic NMDA receptors showed much higher expression levels in auditory areas than in visual areas.
An evaluation of the NMDA receptor identified differences in gene expression between the functional systems analyzed. Even though gene expression of the most abundant composition of subunits of the receptor, called isoform, was particularly high in visual areas, gene expression of several NMDA receptor subunits was altered in other functional systems.
Gene expression patterns of metabotropic receptors were found to be functional system-specific and area-specific. The muscarinic acetylcholine receptor M2 was evaluated in more depth, indicating e.g. that receptor density correlates with its gene expression, but only in three of the sensory systems analyzed and not in the motor system. Furthermore, M2 receptor density decreased from hierarchically lower to higher brain areas, following the flow of information.
The team’s efforts to evaluate the receptor density of ionotropic receptors focused on the inhibitory GABAA receptor and the excitatory glutamatergic NMDA receptor, both of which exhibited very striking patterns. Detailed analysis of the GABAA receptor showed that each sensory system can be characterized by a unique subset of highly expressed GABAA receptor subunit genes. In addition, subunit genes were expressed differently across areas of the same functional system. However, these differences are rather minor compared to differences among subunit genes of different functional systems.
The visual system was found to be unique, as it is characterized by low gene expression of several GABA and NMDA receptor subunits in combination with a high density of GABAA and NMDA receptors. This seems plausible, the research team argues: visual information arriving at the primary visual cortex has already been highly processed since the high number of neurons between the sensory neurons in the retina and the primary cortex raises the hierarchical level of the entire cortical visual system.
As a main finding of this study, it became clear that areas of the human sensory and motor systems are characterized not only by their receptor density profile but also by an area-specific receptor subunit gene expression profile.
Interestingly, gene expression and receptor density were found to change along structural hierarchies within each functional system, from primary to higher associative areas, revealing new principles of brain organization. However, such correlations were not identified for all receptor types, and the degree to which receptor and gene expression data covaried differed between brain areas and functional systems. It could be hypothesized that these observations are related to specific cognitive tasks of a certain functional system in which the respective brain areas are involved.
Conclusion
By combining and analyzing three levels of cortical organization – cytoarchitecture, receptor gene expression and receptor density – within one common frame of reference, this study thus reveals new organizational principles of cortical segregation. Namely, it shows how different modalities change along structural hierarchies within functional systems, revealing a systematic, gradual organization that goes beyond a mere “mosaic” of areas. It not only reveals patterns that are linked to function but also shows underlying relationships, moving us one step closer to an integral understanding of the human brain.
How to reuse
The CC BY 4.0 license requires re-users to give due credit to the creator. It allows re-users to distribute, remix, adapt and build upon the material in any medium or format, even for commercial purposes.
You can reuse this article (e.g., by copying it to your news site) by adding the following line:
New Analysis Provides Comprehensive Insights into the Human Brain’s Organization © 2022 by Stefanie Flunkert is licensed under CC BY 4.0
Or by simply adding:
Article © 2022 by Stefanie Flunkert (CC BY)
To learn more about the available options, and for details, please consult New Ground’s How to reuse section.

This article – but not the graphics or images – is licensed under a Creative Commons Attribution 4.0 International License, which permits use, sharing, adaptation, distribution and reproduction in any medium or format, as long as you give appropriate credit to the original author(s) and the source, provide a link to the Creative Commons license, and indicate if changes were made. The images or other third party material in this article are included in the article's Creative Commons license, unless indicated otherwise in a credit line to the material. If material is not included in the article's Creative Commons license and your intended use is not permitted by statutory regulation or exceeds the permitted use, you will need to obtain permission directly from the copyright holder. To view a copy of this license, visit https://creativecommons.org/licenses/by/4.0/.
This article – but not the graphics or images – is licensed under a Creative Commons Attribution 4.0 License.